Testing Pandora
Pandora needs pangenome graphs (PanRG) as input in order to work. These should be generated with make_prg, and the usage example on GitHub suggests to use multiple sequence alignments (MSA) from panX as input for that. Great, this looks like something my colleague Sara would like!
- Core genes
- Open Questions
- Answers from Zamin Iqbal
- More questions
- Answers from Rachel Colquhoun
- Still more questions
I’m going to download “core gene alignments” and “all gene alignments” for Pseudomonas aeruginosa, of course:
cd /data3/genome_graphs/
mkdir panX_paeru
cd panX_paeru
wget http://pangenome.de/dataset/Pseudomonas_aeruginosa/core_gene_alignments.tar.gz
wget http://pangenome.de/dataset/Pseudomonas_aeruginosa/all_gene_alignments.tar.gz
Core genes
Well then, make_prg needs an index file of the multiple sequence alignments it’s going to combine, so let’s have a look at the compressed file I downloaded.
tar -xzvf core_gene_alignments.tar.gz
cd core_gene_alignments/
The core gene directory contains over 4000 files - nucleotide and amino acid sequences each for the core genes of P. aeruginosa as determined by the panX approach.
We already know that the nucleotide sequences I’m going to work with for now lack stop codons. We hope that this will change eventually, and it shouldn’t be too much of a problem for this test.
Since I don’t plan to use the amino acid sequence alignments at all, I’m going to remove those files before I create the index for make_prg.
rm *aa_aln.fa.gz
mkdir alignments
mv *fa.gz alignments/
cd ..
touch make_index.py
chmod +x make_index.py
./make_index.py core_gene_alignments/alignments core_genes_index.tsv
The index now lists 2266 core genes for P. aeruginosa.
Create a fasta-like pangenome graph
Time for a test run!
nextflow run ../make_prg/make_prg_nexflow.nf --tsv_in core_genes_index.tsv --pipeline_root /data3/genome_graphs/make_prg/
N E X T F L O W  ~  version 19.07.0
Launching `../make_prg/make_prg_nexflow.nf` [infallible_avogadro] - revision: 386e5f21f7
executor >  local (4530)
[f6/1a5f94] process > make_prg (2258)   [100%] 2265 of 2265 ✔
[91/fa24b9] process > make_fasta (2265) [100%] 2265 of 2265 ✔
Completed at: 02-Oct-2019 11:11:43
Duration    : 9m 45s
CPU hours   : 3.5
Succeeded   : 4'530
Cool! Nine minutes and I have a pangenome_PRG.fa file! It looks similar to a fasta file, with headers and sequences, but the sequences also contain numbers which I assume belong to nodes in the graphs. I wonder if there is a way to visualise these graphs? I’ll have to ask, since I can’t find any information on that online.
Since I have no influence over the file name, I’ll move it to the core gene directory, and then I’ll have a look at Pandora itself, starting with the indexing of the graphs.
Indexing the graph(s)
mv pangenome_PRG.fa core_gene_alignments/
cd ../
singularity shell pandora_pandora.sif
cd panX_paeru/core_gene_alignments/
pandora index pangenome_PRG.fa
The indexing ran for around 20 minutes (without Nextflow, there’s no nice duration information). It generates lots of status output about sketching the graphs for the MSA files, and generates a 49 MB index file and a directory (kmer_prgs/01/) with GFA format files for the single graphs. The GFA files are awesome, because now I do have a chance to visualise the graphs, at least one gene at a time! To do that, I will have to install some more tools first, though, and I will do that later, focusing on the read mapping first.
Mapping a single sample
There are two possibilities for read mapping: mapping single samples (Nanopore or Illumina) or mapping several samples to compare the results. Both should return gene (or element) presence/absence and genotyped VCF results.
I will try with a single sample first, and I’ve randomly chosen PA14-like isolate CH3797.
Unfortunately, Pandora doesn’t (yet?) work with paired-end data, so I can only use one of the .fastq files with reads.
pandora map -p pangenome_PRG.fa -r /data3/clinical_isolates_sq/DNA-seq/final_data_all_clinicals/fastq/fastq/CH3797_R1.fastq.gz -o CH3797_R1
bash: /data3/clinical_isolates_sq/DNA-seq/final_data_all_clinicals/fastq/fastq/CH3797_R1.fastq.gz: No such file or directory
Apparently, the reach of the Singularity container is limited in our system, and I can’t access the directory with our clinical isolate data, so I have to copy the FASTQ file:
exit
mkdir sample_data
cp /data3/clinical_isolates_sq/DNA-seq/final_data_all_clinicals/fastq/fastq/CH3797_R1.fastq.gz .
singularity shell pandora_pandora.sif
pandora map -p pangenome_PRG.fa -r ../../sample_data/CH3797_R1.fastq.gz -o CH3797_R1
This time it is running:
START: Wed Oct  2 12:43:55 2019

Using parameters:
        prgfile         pangenome_PRG.fa
        readfile        ../../sample_data/CH3797_R1.fastq.gz
        outdir  CH3797_R1
        w               14
        k               15
        max_diff        250
        error_rate      0.11
        threads 1
        output_kg       0
        output_vcf      0
        vcf_refs
        output_comparison_paths 0
        output_covgs    0
        output_mapped_read_fa   0
        illumina        0
        clean   0
        bin     0
        max_covg        300
        genotype        0
        snps_only       0
        discover        0
        denovo_kmer_size

        log_level       info

Wed Oct  2 12:43:55 2019 Loading Index and LocalPRGs from file
Wed Oct  2 12:44:02 2019 Constructing pangenome::Graph from read file (this will take a while)
[2019-10-02 12:44:38.751004] [0x00007f15a934cf80] [info]    100000 reads processed...
[2019-10-02 12:45:15.222485] [0x00007f15a934cf80] [info]    200000 reads processed...
[2019-10-02 12:45:50.812470] [0x00007f15a934cf80] [info]    300000 reads processed...
[2019-10-02 12:46:25.622956] [0x00007f15a934cf80] [info]    400000 reads processed...
[2019-10-02 12:47:00.004815] [0x00007f15a934cf80] [info]    500000 reads processed...
[2019-10-02 12:47:33.986348] [0x00007f15a934cf80] [info]    600000 reads processed...
[2019-10-02 12:48:07.537543] [0x00007f15a934cf80] [info]    700000 reads processed...
[2019-10-02 12:48:19.061949] [0x00007f15a934cf80] [info]    Processed 734237 reads
Wed Oct  2 12:48:19 2019 Writing pangenome::Graph to file CH3797_R1/pandora.pangraph.gfa
Wed Oct  2 12:48:19 2019 Update LocalPRGs with hits
Wed Oct  2 12:48:20 2019 Estimate parameters for kmer graph model
[2019-10-02 12:48:20.651002] [0x00007f15a934cf80] [info]    Collect kmer coverage distribution
[2019-10-02 12:48:20.659423] [0x00007f15a934cf80] [info]    Writing kmer coverage distribution to CH3797_R1/kmer_covgs.txt
mean, var: 28.4014 39.1444
0 108 43
[2019-10-02 12:48:20.660916] [0x00007f15a934cf80] [info]    Collect kmer probability distribution
[2019-10-02 12:48:21.563465] [0x00007f15a934cf80] [info]    Writing kmer probability distribution to CH3797_R1/kmer_probs.txt
[2019-10-02 12:48:21.563865] [0x00007f15a934cf80] [info]    Estimated threshold for true kmers is -23
Wed Oct  2 12:48:21 2019 Find PRG paths and write to files:
[2019-10-02 12:48:21.604949] [0x00007f15a934cf80] [info]    4.48029% done
[2019-10-02 12:48:21.645390] [0x00007f15a934cf80] [info]    8.96057% done
[2019-10-02 12:48:21.700361] [0x00007f15a934cf80] [info]    13.4409% done
[2019-10-02 12:48:21.760956] [0x00007f15a934cf80] [info]    17.9211% done
[2019-10-02 12:48:21.824591] [0x00007f15a934cf80] [info]    22.4014% done
[2019-10-02 12:48:21.888793] [0x00007f15a934cf80] [info]    26.8817% done
[2019-10-02 12:48:21.956647] [0x00007f15a934cf80] [info]    31.362% done
[2019-10-02 12:48:22.034170] [0x00007f15a934cf80] [info]    35.8423% done
[2019-10-02 12:48:22.116669] [0x00007f15a934cf80] [info]    40.3226% done
[2019-10-02 12:48:22.194769] [0x00007f15a934cf80] [info]    44.8029% done
[2019-10-02 12:48:22.281234] [0x00007f15a934cf80] [info]    49.2832% done
[2019-10-02 12:48:22.360244] [0x00007f15a934cf80] [info]    53.7634% done
[2019-10-02 12:48:22.454212] [0x00007f15a934cf80] [info]    58.2437% done
[2019-10-02 12:48:22.543343] [0x00007f15a934cf80] [info]    62.724% done
[2019-10-02 12:48:22.656645] [0x00007f15a934cf80] [info]    67.2043% done
[2019-10-02 12:48:22.760805] [0x00007f15a934cf80] [info]    71.6846% done
[2019-10-02 12:48:22.852943] [0x00007f15a934cf80] [info]    76.1649% done
[2019-10-02 12:48:22.958296] [0x00007f15a934cf80] [info]    80.6452% done
[2019-10-02 12:48:23.061969] [0x00007f15a934cf80] [info]    85.1254% done
[2019-10-02 12:48:23.172718] [0x00007f15a934cf80] [info]    89.6057% done
[2019-10-02 12:48:23.275705] [0x00007f15a934cf80] [info]    94.086% done
[2019-10-02 12:48:23.381372] [0x00007f15a934cf80] [info]    98.5663% done
FINISH: Wed Oct  2 12:48:23 2019
Five minutes for 2266 core genes, not bad!
The output directory contains four files: kmer_covg.txt, kmer_probs.txt, pandora.consensus.fq.gz, and pandora.pangraph.gfa. There is no VCF file, which I assume is due to me not having a reference annotation (see Pandora usage description):
Usage: pandora map -p PanRG_FILE -r READ_FILE -o OUTDIR <option(s)>
  Options:
   -h,--help                        Show this help message
   -p,--prg_file PanRG_FILE         Specify a fasta-style PanRG file
   -r,--read_file READ_FILE         Specify a file of reads in fasta/q format
   -o,--outdir OUTDIR               Specify directory of output
   -w W                             Window size for (w,k)-minimizers, must be <=k, default 14
   -k K                             K-mer size for (w,k)-minimizers, default 15
   -m,--max_diff INT                Maximum distance between consecutive hits within a cluster, default 250 bps
   -e,--error_rate FLOAT            Estimated error rate for reads, default 0.11/0.001 for Nanopore/Illumina
   -c,--min_cluster_size INT        Minimum number of hits in a cluster to consider a locus present, default 10
   --genome_size NUM_BP             Estimated length of genome, used for coverage estimation, default 5000000
   --vcf_refs REF_FASTA             A fasta file with an entry for each loci in the PanRG in order, giving
                                    reference sequence to be used as VCF ref. Must have a perfect match to a
                                    path in the graph and the same name as the locus in the graph.
   --illumina                       Data is from Illumina, not Nanopore, so is shorter with low error rate
   --bin                            Use binomial model for kmer coverages, default is negative binomial
   --max_covg INT                   Maximum average coverage from reads to accept, default first 300
   --genotype                       Output a genotyped VCF
   --discover                       Add denovo discovery
   --denovo_kmer_size INT           Kmer size to use for denovo discovery, default 11
   --log_level LEVEL                Verbosity for logging, use "debug" for more output
I don’t have a fasta reference for the core genes downloaded from panX, so I can’t generate VCFs - that makes sense. Let’s play with the other options, though!
pandora map -p pangenome_PRG.fa -r ../../sample_data/CH3797_R1.fastq.gz -o CH3797_R1_discover --illumina --discover
START: Wed Oct  2 13:17:30 2019

Using parameters:
        prgfile         pangenome_PRG.fa
        readfile        ../../sample_data/CH3797_R1.fastq.gz
        outdir  CH3797_R1_discover
        w               14
        k               15
        max_diff        31
        error_rate      0.001
        threads 1
        output_kg       0
        output_vcf      0
        vcf_refs
        output_comparison_paths 0
        output_covgs    0
        output_mapped_read_fa   0
        illumina        1
        clean   0
        bin     0
        max_covg        300
        genotype        0
        snps_only       0
        discover        1
        denovo_kmer_size

        log_level       info


FINISH: Wed Oct  2 13:44:20 2019
I’m only copying start time, parameters, and end time to here now, to save space.
This took almost half an hour to run, and created the same files as before, plus a directory with de novo paths. This directory contains 2550 fasta files, with mostly one entry per file, and the file names are the gene IDs from before, together with additional numbers which I expect to be location ranges.
Sooner or later I will need help interpreting these results…
I had a chat with Zamin, but without my data at hand. He says there should be a matrix file with gene presence and absence, but all I have are the coverage and the probability files, which I am quite sure are something else. Maybe this only works with multiple samples?
Gene presence and absence
As it has now turned out that pandora map does indeed not return a gene presence/absence matrix, I’ll use a different way to figure out which genes were present in my sample. Mosaic sequences for found genes are all collected in pandora.consensus.fq.gz, so gene presence/absence can be inferred from there.
exit
cd panX_paeru/core_gene_alignments/CH3797_R1
gunzip pandora.consensus.fq.gz
head pandora.consensus.fq
@GC00002025 log P(data|sequence)=-3.329215
TTGAGGTTACGTAGCCCCTACTGGCTGTTCGTGGTGCTGATCCTGGCGCTGGCGGGCCTGCAATATCGCCTGTGGGTCGGCGATGGCAGCCTGGCGCAGGTGCGCGACCTGCAGAAGCAGATCGCCGACCAGCATGGCGAGAACGAGCGCCTGCTGGAGCGCAACCGGATTCTCGAAGCCGAAGTCGCCGAGCTGAAGAAAGGCACCGAGACCGTCGAGGAGCGTGCGCGGCACGAGCTCGGCATGGTCAAGGACGGCGAAACCCTCTACCAGCTCGCCAAG
+
!!----------------------............//////////////2222222222222221111114445666666666666;;;;;;;;;;;;;;;:::;;;;;;;;;;;;;;;::::::::::::::::::::;;;;;;;;;;;;;;;8888888888888888888888885555555555555555555555554445555555555555553333333333333333333333333333333332222222222222222211111111111
@GC00001504 log P(data|sequence)=-2.890311
ATGCCAGCCGTCAAAGTAAAAGAGAACGAACCCTTCGACGTAGCCCTGCGTCGTTTCAAGCGCTCCTGCGAAAAAGCAGGTGTACTGGCTGAAGTTCGCAGCCGCGAGTTCTACGAGAAGCCCACTGCCGAGCGCAAGCGCAAGGCCGCTGCCGCAGTGAAGCGCCACGCGAAGAAAGTACAGCGCGAACAGCGCCGTCGCGAGCGCCTGTAC
+
!!!888888888888888666668888888888:::::::::::::::::::::::9999999999999999999999::::;;;;;;;;;;;;;;;;;;;;;99999999999999:::::::::::::::99999999999988887777777777777666666655544444433333333333222220000000!!!!!!!!!!!!!
@GC00000511_1 log P(data|sequence)=-6.203405
ATGAAAGCGTTTCTCGGGCTGGGCAAGCTCGTGACCCTGGTGTTCTGGGGCGCGGTGCTGGTCAATCTGCTGCATCCGTTCGCCTATCCGCTGAACTGGCTGTTGTCGATAGCCGGCGGCCTGATCCTGTTGATCCACCTGATCGAGATTCTCGTCCTCGGACGACGCCTGAAAGCGCGCGCGCATCCCTGGCTGGATCGTCTCCAGGTCCTGCTGTTCGGGGTCTTCCACATGCTTGCGTTGCCGGCGCTGAGCCCGGCCAGCGAGTTGCCGCAGGACAAGGAGGACGATCATGCG
If I only want to look at gene presence/absence, it should be enough to take the lines starting with an “@”, since only found genes are included here.
grep "^@GC" pandora.consensus.fq | sed 's/^.//' > found_genes.txt
This command results in a list of 2218 gene IDs (out of 2266 core genes). I included the “GC” to remove one quality string that also started with an “@”, since all gene IDs are starting with “GC”. I also used sed to remove the “@” to be able to compare this list easily with the whole gene list (core_genes_index.tsv).
Well, it’s nice that it’s this easy to get a list of found genes for the single sample mapping after all. Is it true that 48 “core” genes are missing in this clinical isolate, though? Let’s find out which genes these are.
awk 'NR==FNR { a[$1]=$0; next } { if( !($1 in a) ) print $0 }' found_genes.txt /data3/genome_graphs/panX_paeru/core_genes_index.tsv > missing_genes.tsv
I selected a few genes from this list at random to check their identity, hoping to figure out why they were not found in this mapping. Since the most promising data I have for comparison are results from a mapping to PA14, I looked in the alignment files for relevant locus tags. Sadly, the files only contain custom IDs, so I had to take the ID from the alignment file and enter that in the panX database. The problem then is that the database only lists the annotation and gene name, if present, not the locus tag, and for some reason this annotation is not found in my annotation file. If I wanted to find these 48 genes, I think my best bet would be to BLAST the sequences to find their identity in PA14 and then compare to our mapping results. Since this question is not of major importance right now, I’m not going to invest any more time in that, though. Maybe at a later time point, in case we decide to use Pandora for our research.
Generating a VCF file
There are two arguments to pandora map that will generate VCF files. One is --output-vcf which will output the mosaic sequences in VCF format, and --genotype will additionally genotype the sample and add coverage information as well. Since this is on top of the generation of the first VCF file, I think I’ll got with that option.
cd /data3/genome_graphs/
singularity shell pandora_pandora.sif
cd panX_paeru/core_gene_alignments/
pandora map -p pangenome_PRG.fa -r ../../sample_data/CH3797_R1.fastq.gz -o CH3797_R1_genotype --genotype
exit
START: Wed Jan  8 09:28:41 2020

Using parameters:
        prgfile         pangenome_PRG.fa
        readfile        ../../sample_data/CH3797_R1.fastq.gz
        outdir  CH3797_R1_genotype
        w               14
        k               15
        max_diff        250
        error_rate      0.11
        threads 1
        output_kg       0
        output_vcf      1
        vcf_refs
        output_comparison_paths 0
        output_covgs    0
        output_mapped_read_fa   0
        illumina        0
        clean   0
        bin     0
        max_covg        300
        genotype        1
        snps_only       0
        discover        0
        denovo_kmer_size

        log_level       info

Wed Jan  8 09:28:41 2020 Loading Index and LocalPRGs from file
Wed Jan  8 09:28:48 2020 Constructing pangenome::Graph from read file (this will take a while)
[2020-01-08 09:29:21.996411] [0x00007fd741ceff80] [info]    100000 reads processed...
[2020-01-08 09:29:55.678986] [0x00007fd741ceff80] [info]    200000 reads processed...
[2020-01-08 09:30:29.391167] [0x00007fd741ceff80] [info]    300000 reads processed...
[2020-01-08 09:31:02.825737] [0x00007fd741ceff80] [info]    400000 reads processed...
[2020-01-08 09:31:36.682227] [0x00007fd741ceff80] [info]    500000 reads processed...
[2020-01-08 09:32:10.410496] [0x00007fd741ceff80] [info]    600000 reads processed...
[2020-01-08 09:32:43.885851] [0x00007fd741ceff80] [info]    700000 reads processed...
[2020-01-08 09:32:55.391406] [0x00007fd741ceff80] [info]    Processed 734237 reads
Wed Jan  8 09:32:55 2020 Writing pangenome::Graph to file CH3797_R1_genotype/pandora.pangraph.gfa
Wed Jan  8 09:32:56 2020 Update LocalPRGs with hits
Wed Jan  8 09:32:56 2020 Estimate parameters for kmer graph model
[2020-01-08 09:32:56.993133] [0x00007fd741ceff80] [info]    Collect kmer coverage distribution
[2020-01-08 09:32:57.001545] [0x00007fd741ceff80] [info]    Writing kmer coverage distribution to CH3797_R1_genotype/kmer_covgs.txt
mean, var: 28.4014 39.1444
0 108 43
[2020-01-08 09:32:57.003020] [0x00007fd741ceff80] [info]    Collect kmer probability distribution
[2020-01-08 09:32:57.895605] [0x00007fd741ceff80] [info]    Writing kmer probability distribution to CH3797_R1_genotype/kmer_probs.txt
[2020-01-08 09:32:57.895993] [0x00007fd741ceff80] [info]    Estimated threshold for true kmers is -23
Wed Jan  8 09:32:57 2020 Find PRG paths and write to files:
[2020-01-08 09:32:57.905378] [0x00007fd741ceff80] [warning] Input vcf_ref path was too short to be the ref for PRG GC00002025
[2020-01-08 09:32:57.905389] [0x00007fd741ceff80] [warning] Could not find reference sequence for GC00002025 in the PRG so using the consensus path
[2020-01-08 09:32:57.906422] [0x00007fd741ceff80] [warning] Input vcf_ref path was too short to be the ref for PRG GC00001504

[...]

[2020-01-08 09:36:48.102113] [0x00007fd741ceff80] [info]    Wed Jan  8 09:36:48 2020 Genotype VCF
[2020-01-08 09:36:48.512466] [0x00007fd741ceff80] [info]    Wed Jan  8 09:36:48 2020 Make all genotypes compatible

[...]

FINISH: Wed Jan  8 09:36:49 2020
This run took less than ten minutes and generated a lot of warnings (could not find reference in PRG and ref path too short), as well as a lot of information about the two VCF files produced. These two files are now located in CH3797_R1_genotype as pandora_consensus.vcf and pandora_genotyped.vcf, together with the four files that were also generated during the previous mappings (kmer_covg.txt, kmer_probs.txt, pandora.consensus.fq.gz, and pandora.pangraph.gfa). The consensus VCF file is a little smaller than the genotyped file, but they contain the same number of lines (104596). Many of these lines seem to actually be part of the header listing all the contigs (i.e. genes)… As expected, the variants seem to be identical, and it’s only the format and sample columns that are different, with likelihood and genotype confidence included in the genotyped VCF.
Example in gene GC00002553:
| Position | REF | ALT | GT | MEAN_FWD_COVG | MEAN_REV_COVG | MED_FWD_COVG | MED_REV_COVG | SUM_FWD_COVG | SUM_REV_COVG | GAPS | LIKELIHOOD | GT_CONF |
| 1539 | G | C | 0 | 17,9 | 15,7 | 17,9 | 16,7 | 52,18 | 47,15 | 0,0.5 | -76.6101,-166.722 | 90.1119 |
At this position, more reads support the reference allele and the likelihood is higher for the reference (I don’t know how these numbers are generated, though), but both versions are covered. The genotype confidence is therefore “only” 90%.
Well then, back to the warnings as the last thing to look at here…
The first one is “Input vcf_ref path was too short to be the ref for PRG GC00002025”, followed by “Could not find reference sequence for GC00002025 in the PRG so using the consensus path”. So the “vcf_ref path”, whatever that is, could not be found in the pangenome graph for this gene, so in the end the consensus path was used. The first sequence in the original alignment file is only 282 nucleotides long, as is the mosaic sequence in pandora.consensus.fq. So what’s the difference?
Comparing several samples
To make the comparison of multiple samples interesting, I decided to work with the 27 isolates from one of our group’s latest papers. That means I also have a genetic distance tree based on 1021 genes of which proteins could be quantified at my disposal as well:
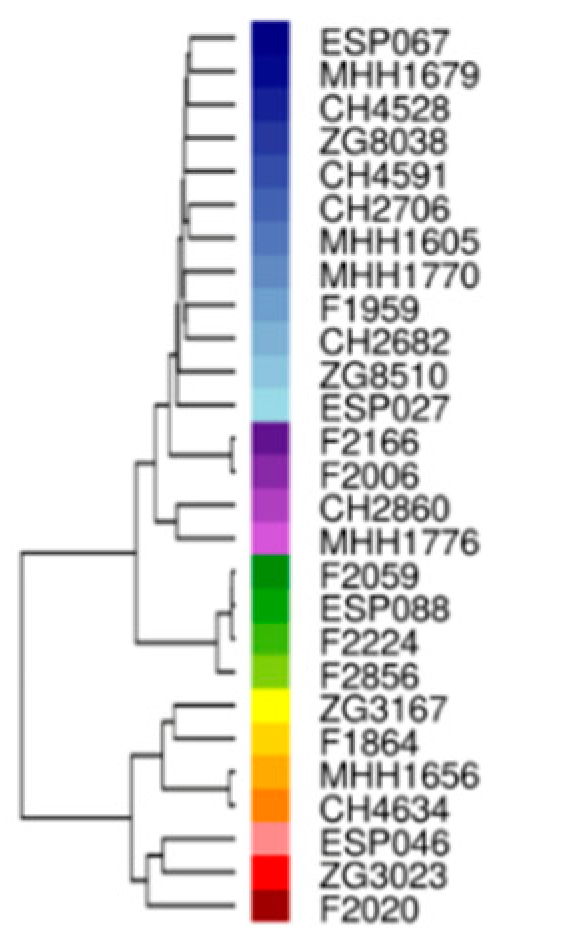
Hierarchical clustering by genetic distance based on the 1021 genes for which the encoded proteins were quantified in this study. PAO1-like strains predominate and are colored in blue-, violet-, and green colors, respectively. PA14-like strains are colored in yellow/orange or red (Erdmann et al., 2019).
To use these isolates, I copied the FASTQ files with the first reads in the pairs to the same sample_data directory where the other single FASTQ file was already located. Then I created a read index with sample ID and FASTQ file name (tab separated) per line as per the Pandora instructions. Now I can start the mapping:
singularity shell pandora_pandora.sif
cd panX_paeru/core_gene_alignments/
pandora compare -p pangenome_PRG.fa -r ../../sample_data/27_isolates.tsv -o 27_isolates --illumina
START: Fri Oct 11 12:03:57 2019

Using parameters:
        prgfile         pangenome_PRG.fa
        read_index_fpath        ../../sample_data/27_isolates.tsv
        outdir  27_isolates
        w               14
        k               15
        max_diff        31
        error_rate      0.001
        threads 1
        vcf_refs
        illumina        1
        clean   0
        bin     0

        max_covg        300
        genotype        0
        log_level       info

Fri Oct 11 12:03:57 2019 Loading Index and LocalPRGs from file
Fri Oct 11 12:04:09 2019 Loading read index file ../../sample_data/27_isolates.tsv
Fri Oct 11 12:04:09 2019 Finished loading 26 samples from read index
[2019-10-11 12:04:09.913091] [0x00007f53d5581f80] [info]    Constructing pangenome::Graph from read file CH2682_S11_L001_R1_001.fastq.gz (this will take a while)
Unable to open fastaq file CH2682_S11_L001_R1_001.fastq.gz
OK, so does pandora compare not like compressed files?
cd ../../sample_data/
gunzip CH2682_S11_L001_R1_001.fastq.gz
cd ../panX_paeru/core_gene_alignments
pandora compare -p pangenome_PRG.fa -r ../../sample_data/27_isolates.tsv -o 27_isolates --illumina
START: Fri Oct 11 12:09:17 2019

Using parameters:
        prgfile         pangenome_PRG.fa
        read_index_fpath        ../../sample_data/27_isolates.tsv
        outdir  27_isolates
        w               14
        k               15
        max_diff        31
        error_rate      0.001
        threads 1
        vcf_refs
        illumina        1
        clean   0
        bin     0

        max_covg        300
        genotype        0
        log_level       info

Fri Oct 11 12:09:17 2019 Loading Index and LocalPRGs from file
Fri Oct 11 12:09:24 2019 Loading read index file ../../sample_data/27_isolates.tsv
Fri Oct 11 12:09:24 2019 Finished loading 26 samples from read index
[2019-10-11 12:09:24.568988] [0x00007ffb6d2bbf80] [info]    Constructing pangenome::Graph from read file CH2682_S11_L001_R1_001.fastq (this will take a while)
Unable to open fastaq file CH2682_S11_L001_R1_001.fastq
No, that doesn’t seem to be the problem. Maybe it would make sense to include the file path in the index file as well…
pandora compare -p pangenome_PRG.fa -r ../../sample_data/27_isolates.tsv -o 27_isolates --illumina
START: Mon Oct 14 08:58:12 2019

Using parameters:
        prgfile         pangenome_PRG.fa
        read_index_fpath        ../../sample_data/27_isolates.tsv
        outdir  27_isolates
        w               14
        k               15
        max_diff        31
        error_rate      0.001
        threads 1
        vcf_refs
        illumina        1
        clean   0
        bin     0

        max_covg        300
        genotype        0
        log_level       info
I accidentally closed the console before I could copy the final output, but I remember that the run was done some time around 14:00 server time, so it took between five and six hours.
After mapping all the samples to the pangenome graph, Pandora does a variant calling, putting out the VCF header for each gene in the pangenome to the console, but also saving the files in a VCFs/01/ directory. The files contain information for all the isolates per SNP: genotype, mean forward/reverse coverage, median forward/reverse coverage, summed forward/reversed coverage and number of gaps.
If there was also output for anything else, I sadly missed it when I closed the console.
The output directory now contains subdirectories for all clinical isolates with the same output data I got from mapping a single sample: kmer_covgs.txt, kmer_probs.txt, pandora.consensus.fq.gz, and pandora.pangraph.gfa. The directory also contains three other files: pandora_multisample_consensus.vcf, pandora_multisample.matrix, pandora_multisample.vcf_ref.fa, and the subdirectory for the single VCF files (with 2266 files, one for each core gene).
Let’s start with the pandora_multisample files. The VCF reference is a multifasta file with one sequence per gene graph. I assume this is some kind of consensus sequence file, but I don’t know for sure.
The matrix file lists all the genes and then, in a tab separated table, states in which samples the gene is present (assuming “1” means presence and “0” means absence). From a short glimpse I would say that most core genes are - as expected - present in all of the 27 clinical isolates I tested.
Finally, there is a consensus VCF file. I assume this lists variations to the consensus sequences in the VCF reference file. This is huge, as it contains variants for all genes in all isolates, in the same format as the single VCF files.
VCF file format
So what exactly do the VCF files look like? I’m choosing a random entry from the big consensus file:
#CHROM  POS     ID      REF     ALT     QUAL    FILTER  INFO    FORMAT  CH2682  CH2706  CH2860  CH4528  CH4591  CH4634  ESP027     ESP046  ESP067  ESP088  F1864   F1959   F2006   F2059   F2166   F2224   F2856   MHH1605 MHH1656 MHH1679 MHH1770 MHH1776    ZG3023  ZG3167  ZG8038  ZG8510
GC00000932_14   120     .       G       C       .       .       SVTYPE=SNP;GRAPHTYPE=SIMPLE     GT:MEAN_FWD_COVG:MEAN_REV_COVG:MED_FWD_COVG:MED_REV_COVG:SUM_FWD_COVG:SUM_REV_COVG:GAPS    0:10,4:11,5:14,0:15,0:42,14:46,15:0.25,0.666667 0:19,8:22,10:25,0:29,0:79,26:89,31:0.25,0.666667   0:13,6:20,9:18,0:27,0:55,19:82,27:0.25,0.666667 0:6,2:3,2:8,0:2,0:25,8:13,6:0,0.666667     0:10,4:10,5:14,0:14,0:43,14:43,15:0.25,0.666667 0:11,5:10,4:14,0:12,0:45,16:40,12:0.25,0.666667 0:31,13:22,10:39,0:30,0:124,39:91,30:0.25,0.666667 0:23,11:33,14:29,0:43,0:93,33:133,43:0,0.666667 0:13,5:15,6:17,0:20,0:54,16:63,20:0.25,0.666667    0:19,8:17,8:25,0:23,0:76,25:70,24:0.25,0.666667 1:14,59:19,77:0,59:0,77:59,177:79,233:0.75,0    0:38,17:38,18:49,0:50,0:153,51:155,54:0,0.666667   0:16,7:14,7:22,0:17,0:67,22:57,22:0.25,0.666667 0:19,9:20,9:25,0:27,0:78,27:83,28:0.25,0.666667    0:25,12:30,12:32,0:39,0:101,36:123,38:0,0.666667        0:13,5:19,8:17,0:25,0:54,17:78,25:0.25,0.666667 0:13,5:20,9:17,0:27,0:53,17:82,28:0.25,0.666667    0:14,6:17,8:19,0:21,0:59,20:68,24:0.25,0.666667 0:11,5:9,4:13,0:12,0:44,16:36,12:0.25,0.666667     0:24,10:27,12:31,0:36,0:96,32:110,37:0.25,0.666667      0:15,7:19,8:19,0:25,0:61,22:76,25:0.25,0.666667 0:17,7:23,10:23,0:31,0:69,23:93,31:0.25,0.666667   0:9,4:7,3:12,0:9,0:37,13:29,9:0.25,0.666667     0:16,8:32,14:21,0:41,0:67,24:129,43:0.25,0.666667  0:36,15:37,16:48,0:49,0:146,47:150,50:0.25,0.666667     0:36,14:26,13:45,0:34,0:144,44:107,39:0,0.666667
The “chromosome” is here the gene, and the position should be measured from the start codon (or wherever the original multiple sequence alignment started). ID, quality and filter are not given (“.”), but reference and alternative variant are shown as “G” and “C”, so we have a single nucleotide variant. This is also acknowledged in the “info” column: variant type is SNP and graph type is simple (there is also “nested”).
The next column explains the format of the following sample-wise columns: the values for genotype, mean forward/reverse coverage, median forward/reverse coverage, summed forward/reversed coverage and number of gaps are each separated by colons, while the values for reference and alternative are separated by commas. The isolates at the end are sorted alphabetically. The GT (genotype) field contains a 0 for all but one isolate, meaning only this one isolates contains the alternative variant according to the VCF documentation.
Looking at two example isolates, I think the values can be interpreted the following way:
| isolate | GT | MEAN_FWD_COVG | MEAN_REV_COVG | MED_FWD_COVG | MED_REV_COVG | SUM_FWD_COVG | SUM_REV_COVG | GAPS |
|---|---|---|---|---|---|---|---|---|
| CH2682 | 0 | 10,4 | 11,5 | 14,0 | 15,0 | 42,14 | 46,15 | 0.25,0.666667 |
| F1864 | 1 | 14,59 | 19,77 | 0,59 | 0,77 | 59,177 | 79,233 | 0.75,0 |
Isolate CH2682 has the wildtype genotype, but does show a little coverage of the alternative allele (e.g. overall forward coverage 42 reads for the wildtype, 14 for the alternative, and 46 and 15 on the reverse strand). F1864 on the other hand has a strong preference for the alternative allele (59 to 177 forward and 79 to 233 reverse reads). Is it common to have almost equal forward and reverse coverage? - Of course it is, I just was too used to strand-specific RNA-seq data and got confused.
Core gene tree
In order to generate a phylogenetic tree based on the 2266 core genes, I think I will extract the consensus sequences from the pandora.consensus.fq files for each isolate and build a tree from those using our standard approach. Since these sequences should be the mosaic sequences for each individual sample, they should give a good approximation. Depending on how complex I’m going to make the extraction, there’s a good chance I’m going to have different numbers of genes in the different samples, and a different order as well, but this shouldn’t be a problem for the k-mer approach.
cd /data3/genome_graphs/panX_paeru/core_gene_alignments/27_isolates/CH2682/
awk -v ORS="NNANN" 'printf (NR%4==2)' pandora.consensus.fq > CH2682.txt
./get_sequences.sh
Based on the awk command above I wrote a shell script (get_sequences.sh) that creates a multi-fasta file with one sequence per isolate. These sequences contain all gene sequences from pandora.consensus.fq per isolate, joined with “NNANN” (because we usually do it like that). The resulting file (27_isolates.merged.fasta) I can now feed into the scripts we use to calculate phylogenetic distance based on k-mers.
python /data3/scripts/kmerdist_spo12.py -m 27_isolates.merged.fasta -n 27_isolates.tdb -l 27_isolates.log -o 27_isolates.dist &
python /data3/scripts/distmatrix.py -f 27_isolates.dist -o 27_isolates.dst -d 4 &
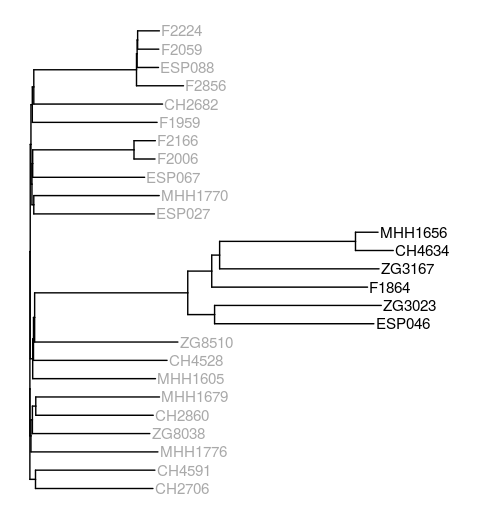
Phylogenetic tree based on mosaic sequences generated by mapping sequencing reads of the samples to the core gene pangenome graph. PAO1-like isolates are coloured in dark gray, PA14-like isolates are coloured in black.
I created a neighbour joining tree using ape and visualised this with ggtree. The resulting tree is different from the one generated based on protein data, but at least the PAO1- and PA14-like isolates cluster together as expected. I did not expect the PA14-like isolates to be a sub-cluster of one of the PAO1-like clusters, though.
I also realised only now that one isolate - F2020 - is missing from the tree and, as it turns out, also from the mapping results. It was the last isolate on my list, I don’t know why it wasn’t included in the mapping. Since I didn’t pay attention to the mapping output, and no automatic log was created, I guess I have to start the mapping again to figure out what happened.
Open Questions
- Where can I find gene presence/absence information?
- Suggestion for fasta reference for VCF creation when using panX data?
- What are the graphs created after mapping?
- What does the de novo discovery do, exactly?
Answers from Zamin Iqbal
- The numbers in the PRG file are separators of different parts of the graph.
- Gene presence and absence should be found in a matrix file.
- A reference for variant calling is not needed. It happens automatically when using
pandora compare. - The de novo discovery can be used to complement the graph.
More questions
- What are the sequences in pandora_multisample.vcf_ref.fa?
- What is the GAPS value in the VCF files?
- What does it mean when a variant has almost equal forward and reverse coverage?
- Why don’t we get the same output when mapping single or multiple samples?
- What is the reference in the VCF file?
Answers from Rachel Colquhoun
Rachel left a long and very helpful comment below this post answering my questions. Thank you very much for that! I’m going to summarise the answers here and copy the whole thing to my Q&A page. She also clarified the differences between pandora map and pandora compare on GitHub, which led me to check the options of those commands again and apparently they changed since I first wrote this protocol. Is the Singularity container updating itself?
- The sequences in pandora_multisample.vcf_ref.fa are reference sequences for the variant calling. They are chosen to be as close as possible to the samples that were mapped and for which the VCF is generated.
- The gaps are coverage gaps in the allele, or better: of kmers covering the allele.
- Illumina reads usually should have almost equal forward and reverse coverage. I am not sure how I could get confused there.
-
pandora mapis an option for cases where only one sample is available, and therefor has a different output. Using the--output-vcfor--genotypeoptions should still lead to a VCF file for this single sample. Gene presence/absence can be judged from the pandora.consensus.fq.gz file (only genes which were covered in the mapping are included). - There is no plan to allow paired-end mapping input in Pandora. It’s possible to concatenate the two read files, but then the reads should probably be “shuffled” (my wording), since Pandora stops reading the input file once a coverage threshold (which can be defined with
--max_covg) is reached.
Still more questions
- What are the warnings “Input vcf_ref path was too short to be the ref” and “Could not find reference sequence in the PRG so using the consensus path” about?
- The warnings can be ignored. The first one is already being removed, and the second will be removed or changed as well.
Back to main page.